Abstract
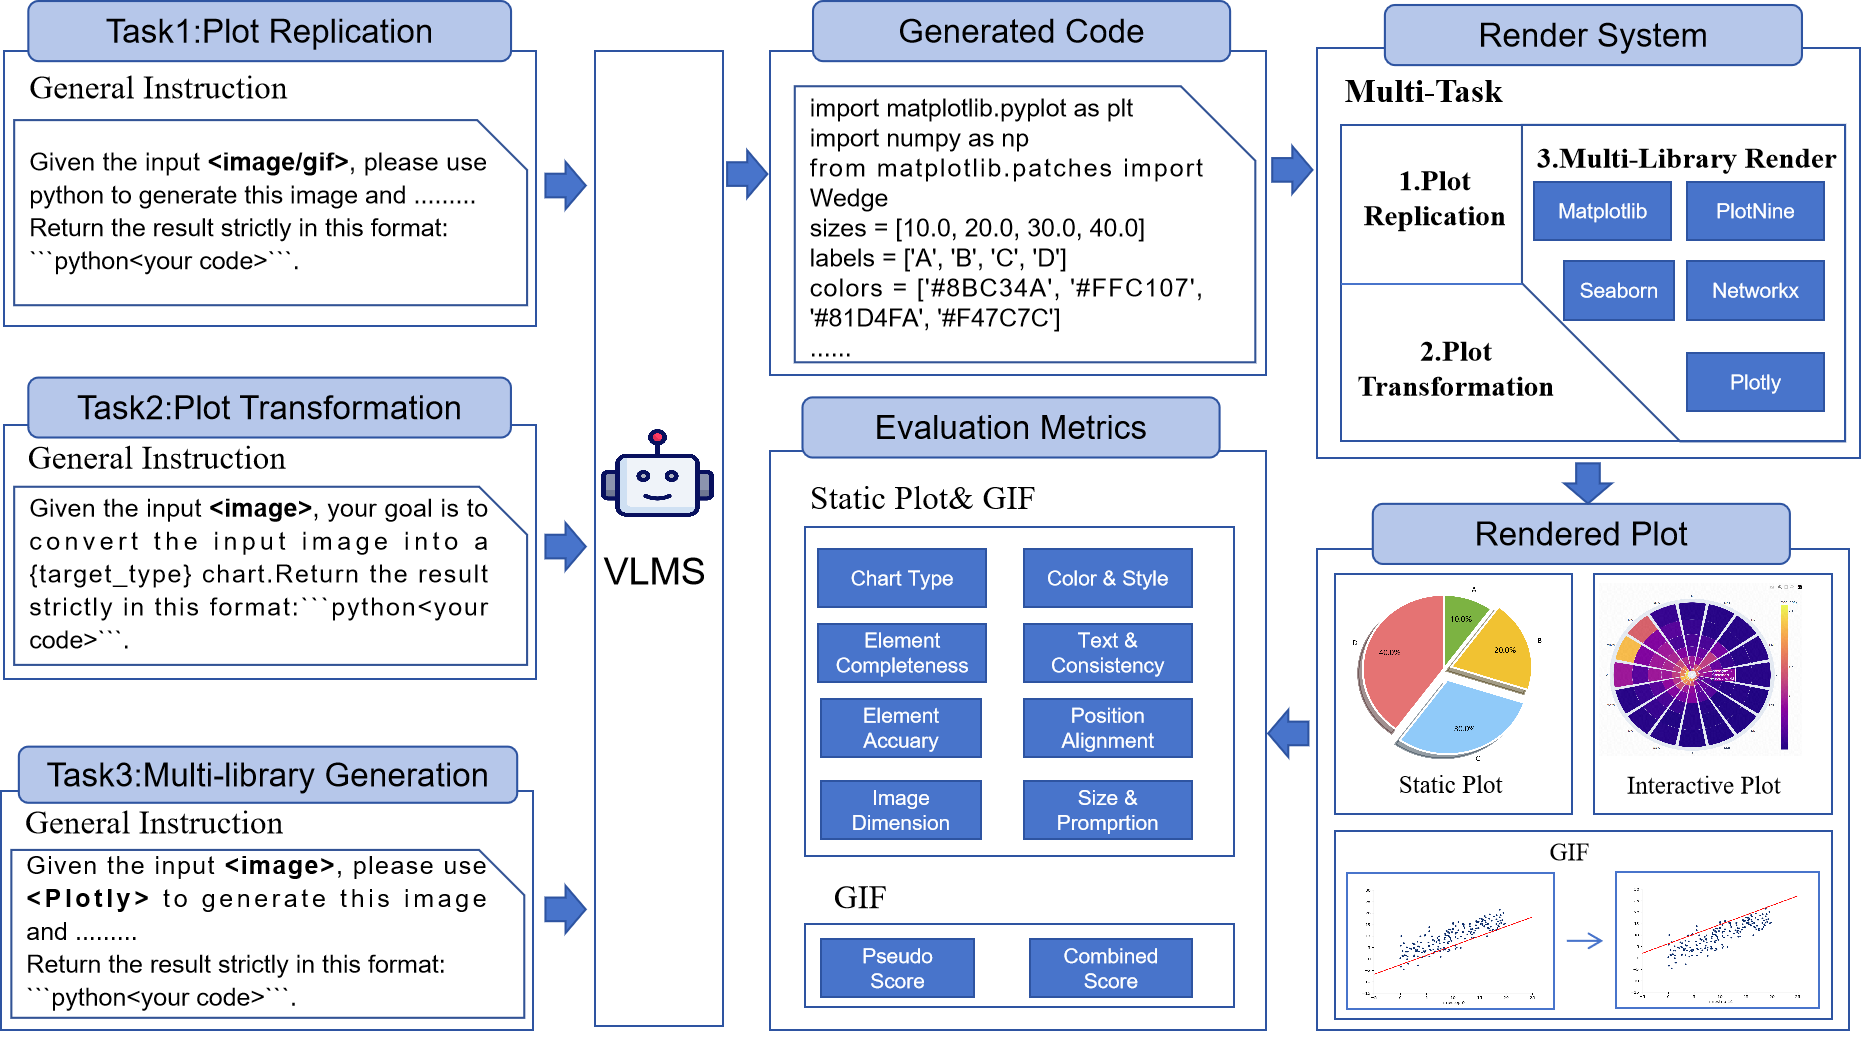
Recent advances in vision–language models (VLMs) have expanded their multimodal code generation capabilities, yet their ability to generate executable visualization code from plots, especially for complex 3D, animated, plot-to-plot transformations, or multi-library scenarios, remains underexplored. To address this gap, we introduce PlotGen-Bench, a comprehensive benchmark for evaluating plot-to-code generation under realistic and complex visualization scenarios. The benchmark spans 9 major categories, 30 subcategories, and 3 core tasks—plot replication, plot transformation, and multi-library generation, covering both 2D, 3D and animated plots across 5 widely used visualization libraries. Through systematic evaluation of state-of-the-art open- and closed-source VLMs, we find that open-source models still lag considerably behind in visual fidelity and semantic consistency, despite achieving comparable code executability. Moreover, all models exhibit substantial degradation on reasoning-intensive tasks such as chart type conversion and animation generation. PlotGen-Bench establishes a rigorous foundation for advancing research toward more capable and reliable VLMs for visualization authoring and code synthesis.
Research Overview
Performance Comparison Across Different Plot Types
| Model | Dist. | Comp. | Trend | Comp. | Corr. | Flow | Dim. | Enh. | Anim. | Overall |
|---|---|---|---|---|---|---|---|---|---|---|
| Open-source VLM | ||||||||||
| InternVL3-9B | 16.0 | 26.8 | 21.7 | 20.8 | 13.3 | 25.0 | 17.7 | 25.3 | 2.5 | 21.8 |
| InternVL3-78B | 43.4 | 55.7 | 39.6 | 47.3 | 49.0 | 40.4 | 55.9 | 48.0 | 33.2 | 48.3 |
| Qwen2.5-VL-7B-Instruct | 34.3 | 47.2 | 28.0 | 31.7 | 28.6 | 25.4 | 44.4 | 35.6 | 2.6 | 35.2 |
| Qwen2.5-VL-72B-Instruct | 56.2 | 61.1 | 48.0 | 52.8 | 60.2 | 51.7 | 71.8 | 55.4 | 32.0 | 56.4 |
| MiMo-VL-7B-SFT | 22.5 | 29.0 | 24.3 | 25.4 | 28.9 | 23.7 | 28.7 | 31.2 | 7.0 | 27.4 |
| MiMo-VL-7B-RL | 21.2 | 24.0 | 25.5 | 23.4 | 29.2 | 18.1 | 24.8 | 28.9 | 6.4 | 25.7 |
| Kimi-VL-A3B-Instruct | 33.4 | 39.9 | 40.6 | 25.5 | 31.0 | 31.0 | 30.3 | 38.0 | 17.7 | 34.4 |
| Kimi-VL-A3B-Thinking | 18.3 | 34.4 | 17.3 | 16.6 | 19.5 | 10.8 | 19.2 | 21.0 | 5.5 | 20.3 |
| GLM-4.1V-9B-Thinking | 32.4 | 44.2 | 31.9 | 33.8 | 35.0 | 47.0 | 34.4 | 40.0 | -- | 26.9 |
| GLM-4.5V | 48.6 | 52.0 | 44.2 | 43.5 | 40.2 | 28.9 | 51.2 | 50.9 | -- | 47.2 |
| Qwen3-VL-235B-A22B-Instruct | 64.7 | 71.0 | 60.6 | 66.4 | 66.8 | 61.5 | 65.1 | 62.3 | 38.1 | 64.6 |
| Closed-source VLM | ||||||||||
| Claude-Sonnet-4-20250514-Thinking | 76.7 | 76.2 | 72.7 | 74.3 | 76.1 | 50.1 | 82.9 | 72.5 | 44.5 | 74.1 |
| Claude-3.7-Sonnet-20250219-Thinking | 73.7 | 79.9 | 72.8 | 74.4 | 81.0 | 69.5 | 67.6 | 72.8 | 34.5 | 74.0 |
| GPT-5-2025-08-07 | 78.7 | 87.8 | 76.1 | 78.3 | 78.4 | 75.0 | 81.9 | 79.9 | 45.2 | 79.7 |
| GPT-4o-2024-11-20 | 69.1 | 71.5 | 69.1 | 58.5 | 68.2 | 68.7 | 70.1 | 69.8 | 41.7 | 67.7 |
| GPT-4o-Mini-2024-07-18 | 51.2 | 62.8 | 54.4 | 52.4 | 51.8 | 54.9 | 61.2 | 57.2 | 37.1 | 55.5 |
| Gemini-2.5-Pro | 73.1 | 76.8 | 70.7 | 76.0 | 75.3 | 59.5 | 76.3 | 67.7 | -- | 72.0 |
| Gemini-2.5-Flash | 57.3 | 60.3 | 44.7 | 55.1 | 61.9 | 54.1 | 56.0 | 59.9 | -- | 60.0 |
| Doubao-1.5-Thinking-Pro-Vision-250415 | 48.6 | 55.7 | 52.0 | 38.6 | 48.9 | 45.6 | 51.8 | 50.8 | 28.6 | 48.7 |
| Doubao-Seed-1-6-Thinking-250715 | 55.2 | 67.9 | 54.0 | 54.5 | 52.7 | 47.7 | 57.3 | 58.9 | 32.5 | 57.1 |
Performance Comparison Across Different Libraries
| Model | Matplotlib | Seaborn | Plotly | Plotnine | NetworkX | |||||
|---|---|---|---|---|---|---|---|---|---|---|
| PR | GS | PR | GS | PR | GS | PR | GS | PR | GS | |
| Open-source VLM | ||||||||||
| InternVL3-9B | 43.4 | 20.7 | 20.4 | 6.9 | 46.5 | 19.3 | 0.0 | 0.0 | 41.7 | 21.5 |
| InternVL3-78B | 71.7 | 43.1 | 69.4 | 42.7 | 81.4 | 52.0 | 21.1 | 11.9 | 86.1 | 56.5 |
| Qwen2.5-VL-7B-Instruct | 71.7 | 28.7 | 57.1 | 31.3 | 79.1 | 45.0 | 0.0 | 0.0 | 75.0 | 35.2 |
| Qwen2.5-VL-72B-Instruct | 84.7 | 53.1 | 77.6 | 55.1 | 79.1 | 53.3 | 15.8 | 13.5 | 83.3 | 58.0 |
| MiMo-VL-7B-SFT | 56.5 | 30.7 | 34.7 | 17.2 | 2.3 | 1.0 | 10.5 | 2.7 | 47.2 | 21.8 |
| MiMo-VL-7B-RL | 60.9 | 27.4 | 28.6 | 16.2 | 7.0 | 4.2 | 0.0 | 0.0 | 47.2 | 26.2 |
| Kimi-VL-A3B-Instruct | 32.6 | 8.8 | 61.2 | 34.0 | 18.6 | 12.4 | 36.8 | 15.8 | 72.2 | 35.1 |
| Kimi-VL-A3B-Thinking | 45.7 | 12.0 | 26.5 | 14.4 | 11.6 | 6.3 | 0.0 | 0.0 | 38.9 | 18.2 |
| GLM-4.1V-9B-Thinking | 58.7 | 34.1 | 46.9 | 33.0 | 51.1 | 32.5 | 0.0 | 0.0 | 61.1 | 43.1 |
| GLM-4.5V | 58.7 | 44.4 | 49.0 | 38.7 | 32.5 | 22.4 | 21.1 | 17.3 | 52.8 | 39.5 |
| Qwen3-VL-235B-A22B-Instruct | 93.5 | 62 | 87.8 | 62.8 | 79.1 | 58.1 | 63.2 | 41.6 | 97.2 | 72.0 |
| Closed-source VLM | ||||||||||
| Claude-Sonnet-4-20250514-Thinking | 97.8 | 74.4 | 93.9 | 75.7 | 83.7 | 59.3 | 36.8 | 29.5 | 100.0 | 81.1 |
| Claude-3.7-Sonnet-20250219-Thinking | 93.5 | 78.6 | 87.8 | 73.0 | 87.0 | 64.2 | 5.3 | 4.2 | 94.4 | 79.8 |
| GPT-5-2025-08-07 | 93.5 | 82.7 | 91.8 | 78.9 | 88.3 | 76.9 | 36.8 | 27.7 | 86.1 | 72.1 |
| GPT-4o-2024-11-20 | 89.1 | 65.6 | 85.7 | 64.4 | 86.0 | 61.5 | 68.4 | 41.3 | 91.7 | 69.5 |
| GPT-4o-Mini-2024-07-18 | 82.6 | 52.2 | 75.5 | 54.0 | 79.1 | 49.0 | 42.1 | 28.6 | 91.7 | 52.2 |
| Gemini-2.5-Pro | 82.6 | 74.2 | 89.8 | 80.9 | 72.1 | 60.4 | 10.5 | 8.0 | 97.2 | 85.0 |
| Gemini-2.5-Flash | 67.3 | 56.2 | 77.5 | 67.1 | 44.2 | 37.2 | 15.7 | 13.0 | 72.2 | 63.4 |
| Doubao-1.5-Thinking-Pro-Vision-250415 | 65.2 | 50.1 | 36.7 | 28.0 | 44.2 | 34.2 | 10.5 | 8.0 | 61.1 | 46.8 |
| Doubao-Seed-1-6-Thinking-250715 | 80.4 | 65.8 | 53.1 | 40.4 | 34.8 | 30.0 | 26.3 | 20.8 | 66.7 | 54.8 |
Data Download
The PlotGen-Bench dataset is publicly available for research purposes. It contains over 745 plot-code pairs across 9 major categories, 30 subcategories, and 5 widely used visualization libraries. The dataset is split into training, validation, and test sets to facilitate model development and evaluation.
Download Dataset